


The per class and per student budget (the study deals only with budgets allocated by the Ministry of Education) in regular official primary education (institutions containing grades 1-6 only) increased significantly in recent years. Most school budgets are allocated according to fixed formulas. However, despite the universal formulas, after controlling for various school characteristics, budgeting is highest in State-religious schools and lowest in Arab Israeli schools.
Primary education budgeting
The budgeting of primary schools in Israel today is determined by a combination of three main budgeting sources that reflect educational, social, and ideological considerations.
1. The basic allocation (“the basic standard”): this guarantees a minimum number of teacher work hours necessary to provide the required curriculum and achieve other educational goals.
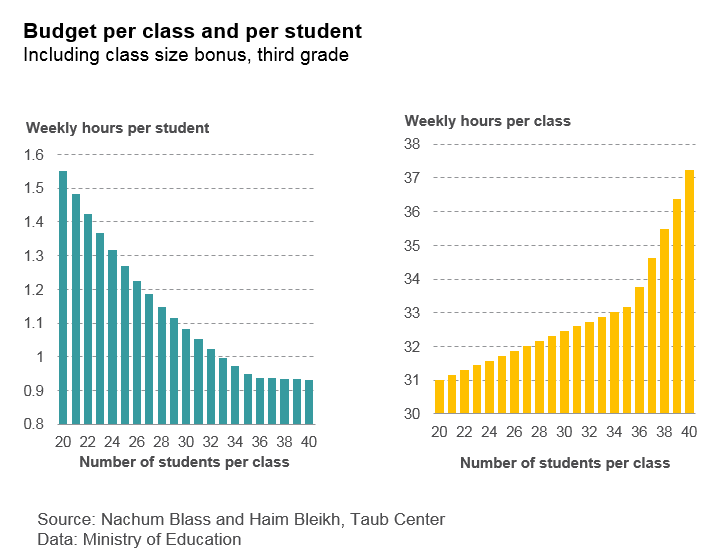
- The basic standard part of the budget transferred to educational institutions depends on the number of classes and not on the number of students. Given that 20 students is the minimum number of students per class, each additional student entitles the school to a supplementary budget and when the number of students is less than 20 the class receives only half of the basic standard budget. Thus, a rise in the number of students raises the budget per class, but budgeting per student goes down the larger the class size.
- The cutoff for the number of students considered a “class” for budgeting purposes (regardless of how many classes the students are split into in practice) is different based on the school’s Nurture Index (the higher the index, the weaker the socioeconomic profile of the school’s students): 32 for schools with a weakest socioeconomic background and 40 for schools with a highest socioeconomic background. On the ground, this means that two schools with the same number of students could be considered as having a different number of budgetary classes, impacting the schools’ overall budgets.
- An educational policy decision to gradually reduce the number of students per class to a maximum of 34 applies to all students in grades 1-3 as of the end of 2018.
2. Dedicated “baskets”: these budgets are added to the basic standard, according to fixed formulas, based on the school’s student profile. They are “earmarked” for specific purposes.
- The Nurture basket – which has the purpose of improving educational achievements of students from weak socioeconomic backgrounds and was increased in 2014.
- The mainstreaming basket – which aims to integrate students with special needs into regular classrooms – is allocated by a fixed formula: 5.4% of all students in all schools receive an addition of 1.85 weekly teaching hours each.
- The prayer time basket – for prayer hours at Hebrew State-religious schools – is 1.22 weekly hours per standard class.
- The absorption basket – for immigrants and returning residents – takes into account country of origin and length of presence in Israel.
3. Other allocations (“baskets”): additional discretionary baskets based on a school’s inclusion in specific projects, or that stem from a recognition of a special need.
Factors that influence the school budget
The study takes a closer look and examines the influence of various school variables on budgeting per class and per student: the Nurture Index, school size, whether the school is part of the long school day program or not, the presence or absence of Special Education classes, the education sector and school supervisory authority, the median seniority of teachers, and the share of teachers with advanced degrees.
The results focus on two main aspects: the marginal effect of each variable on budgeting and the degree to which each variable contributes to the explained variance.
The results of a multivariate analysis, after controlling for various school characteristics, shows that most of the per student budget and of the per class budget can be explained by these variables:
- The vast majority of the explained variance – 87% for per class budgeting and 92% for per student budgeting – has to do with factors that are difficult to influence, such as: Nurture Index, participation in the “long school day” program, and the size of the school.
- Sector and type of supervision, on the other hand, explain a much smaller share of the explained variance: about 13% for per class budget and 8% for per student budget.

More research on this topic

A Picture of the Nation 2026: Israel’s Society and Economy in Figures
The Taub Center is publishing this year’s A Picture...
Avi Weiss
“Boundary Crossing Teachers”: A Possible Solution to Staffing Gaps in the Education System
This study by the Taub Center for Social Policy...
David Maagan Nachum Blass
On Real and Perceived Crises in the Education System
State of the Nation Report 2025 – Chapter: Education...
Nachum Blass
Pisa Predictive Power of Future Educational Attainments: A Longitudinal Study
This study shows that performance on international PISA exams...
Nachum Blass David Maagan Zemira R. Mevarech Joel Rapp